April 21, 2026
Jacky Fan
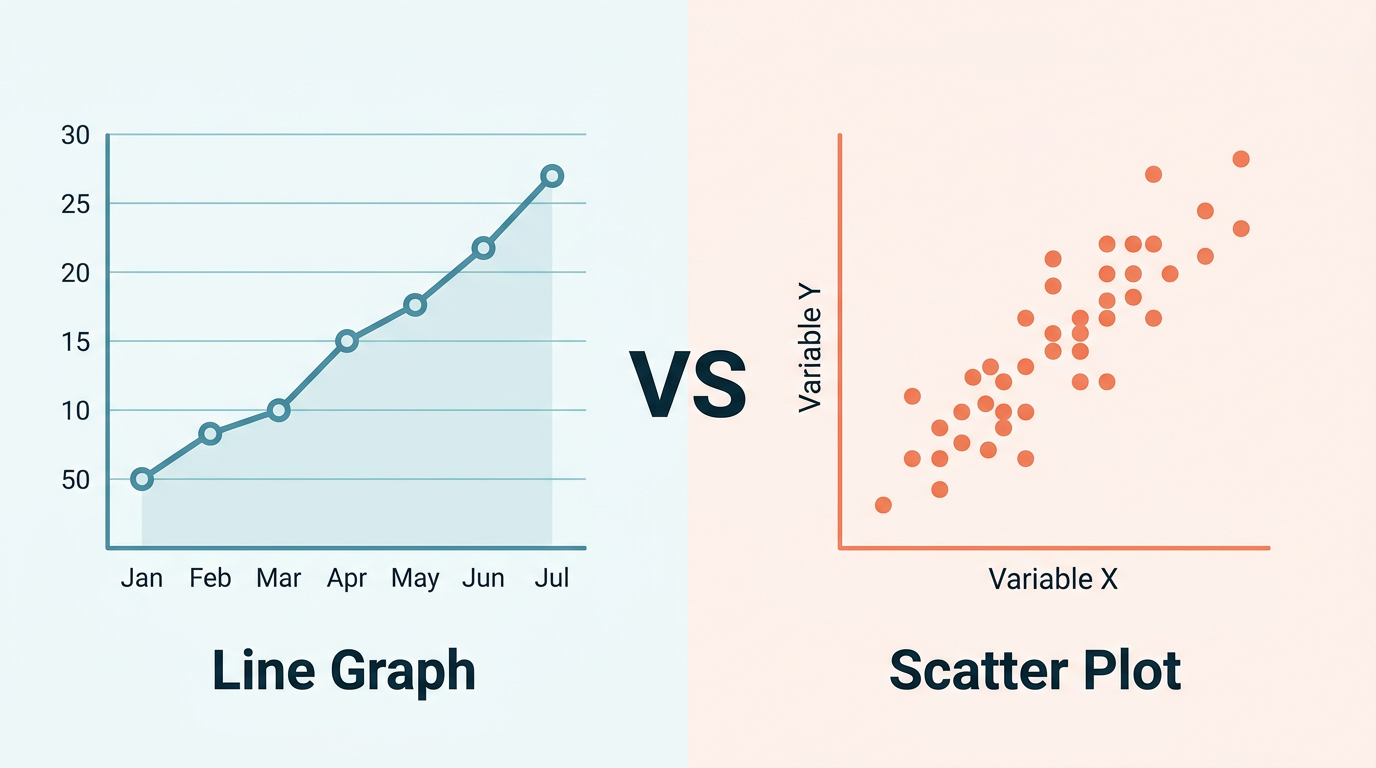
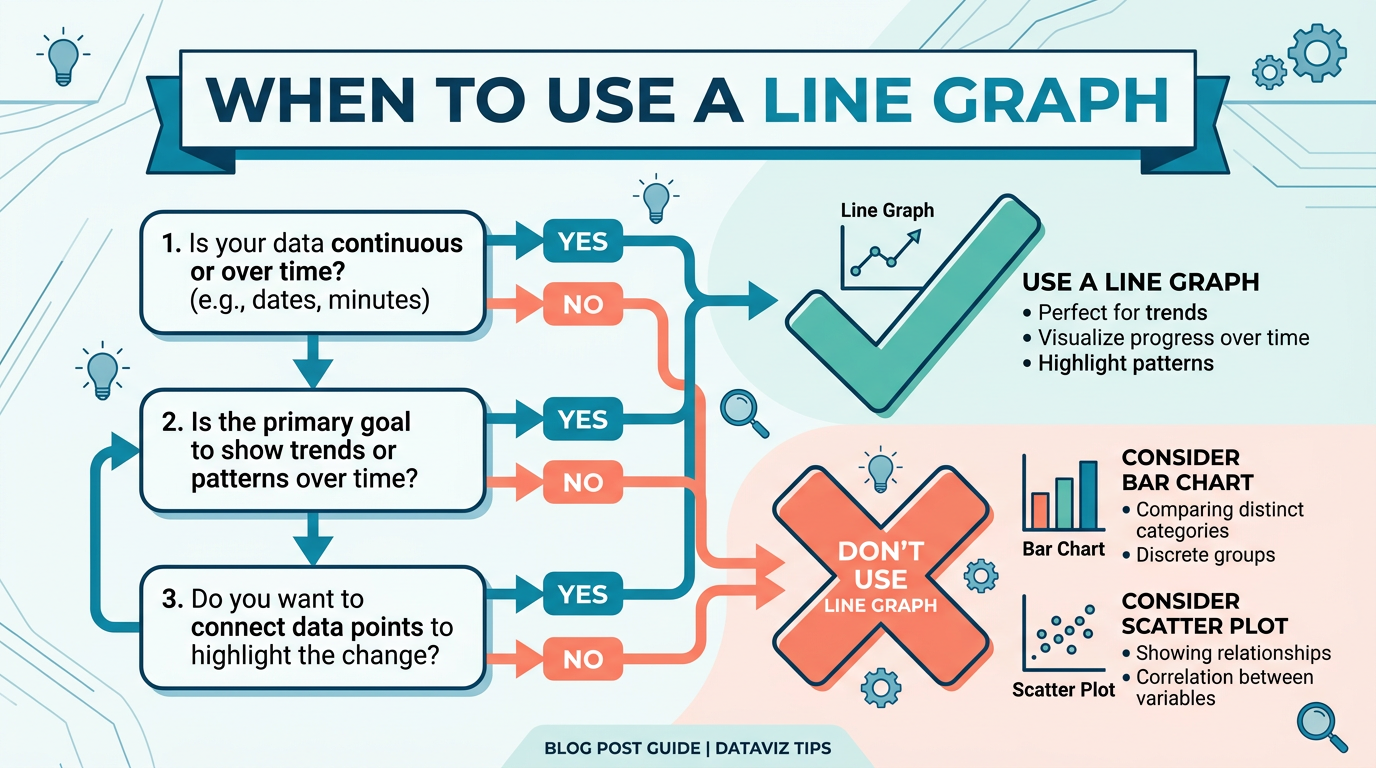
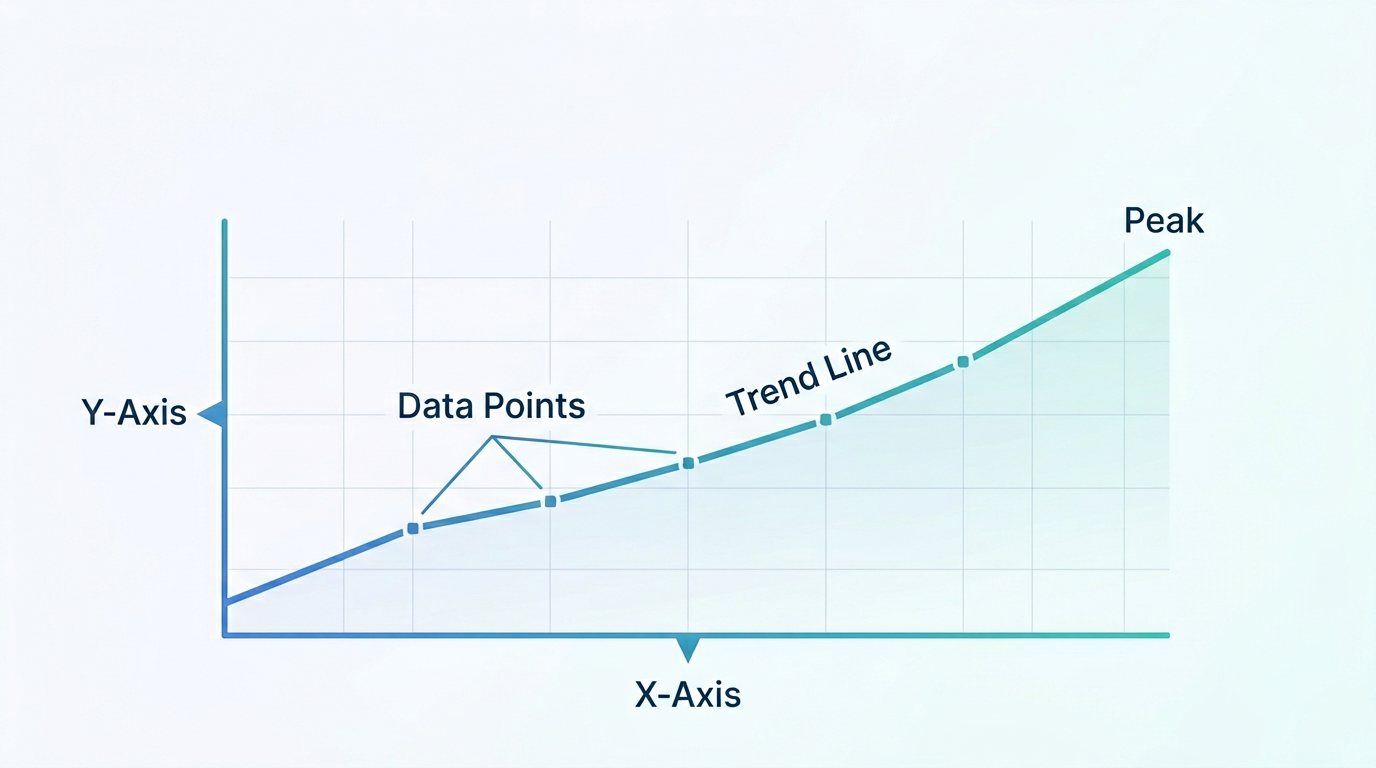
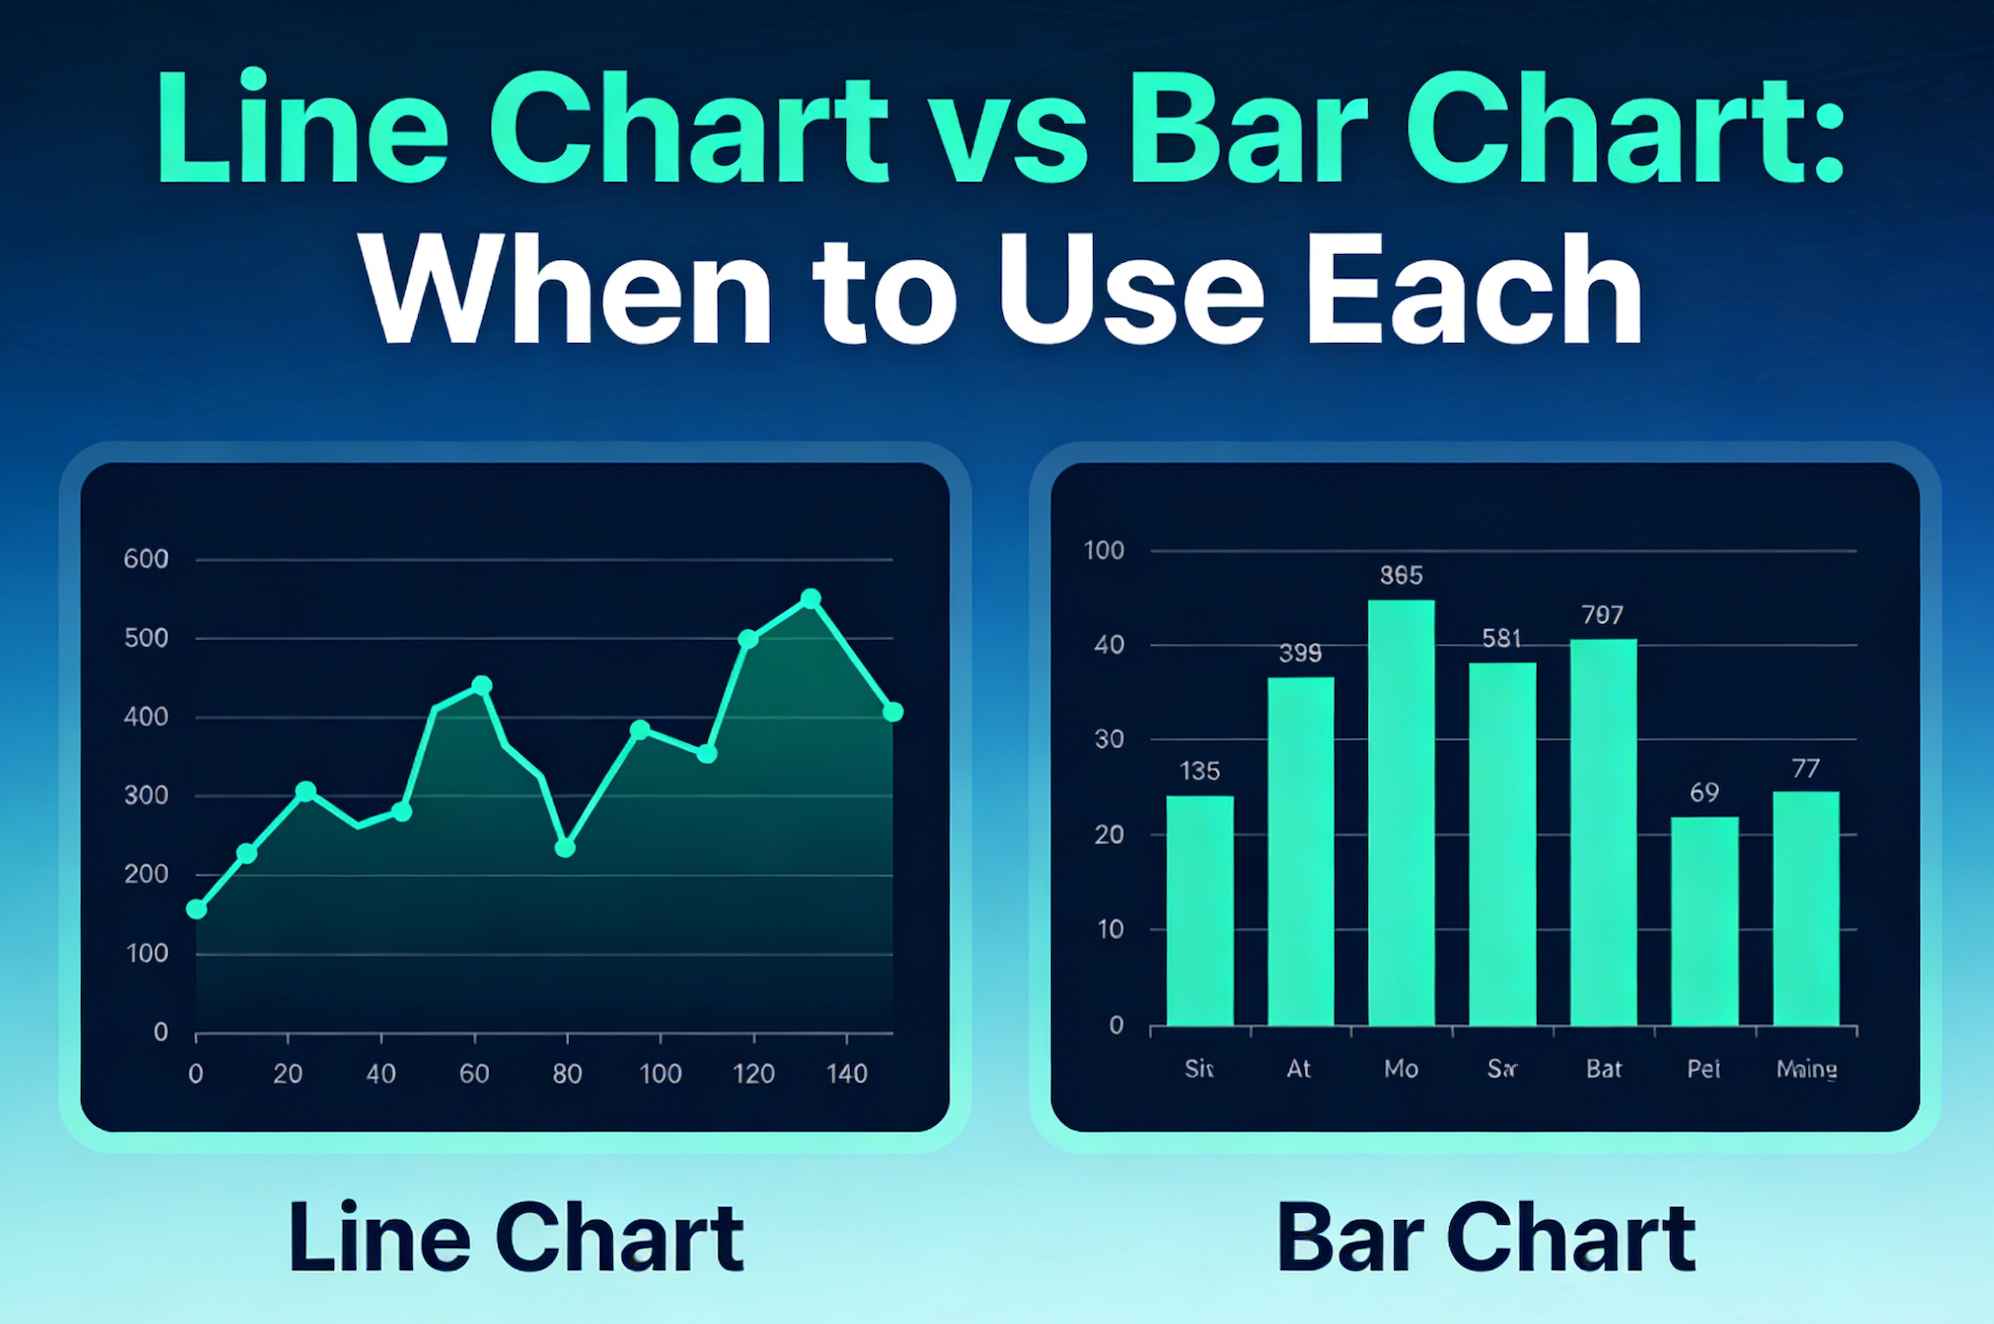
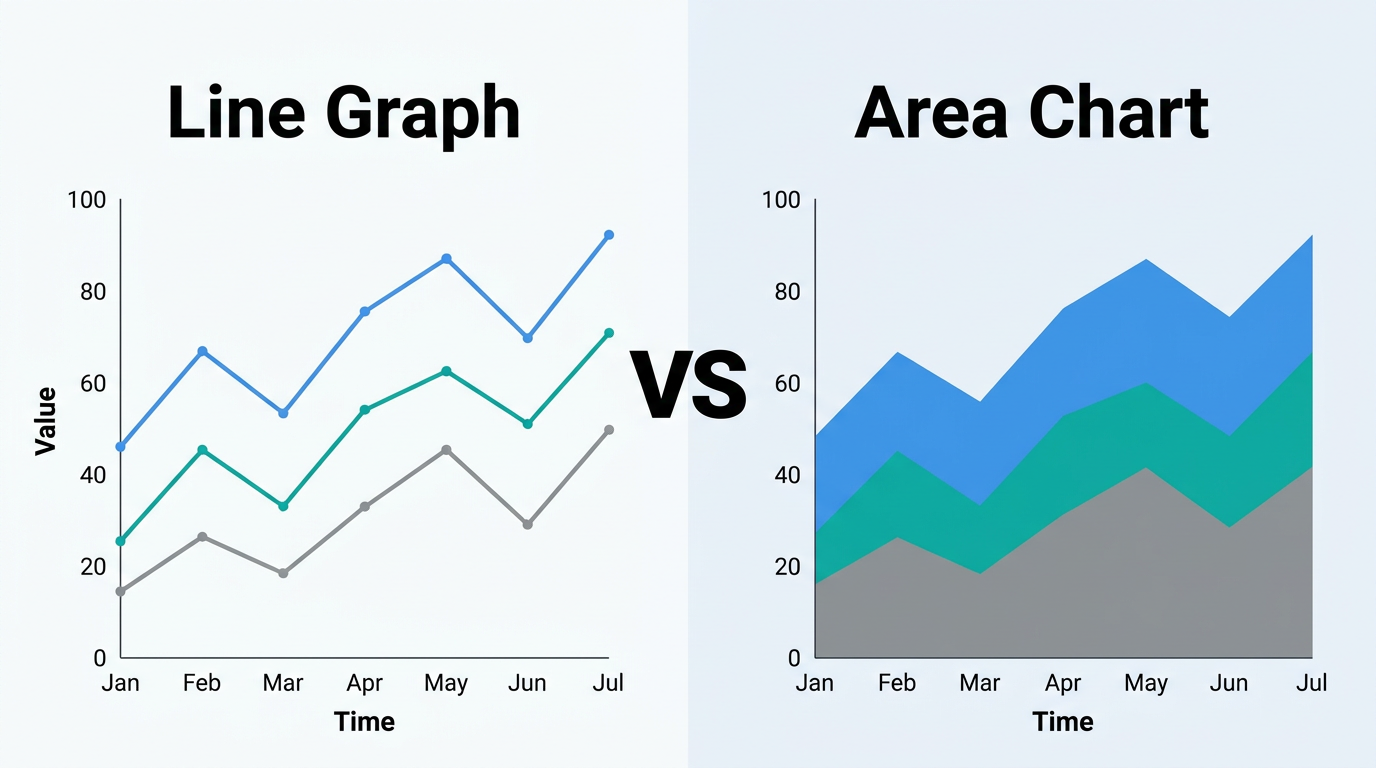
Line Graph vs Area Chart: When to Use
Line graphs and area charts share the same DNA — one just fills the space below the line. But that fill changes the message. Learn when the filled area adds meaning and when it creates confusion.
Read more →