Line Graph vs Area Chart: When to Use
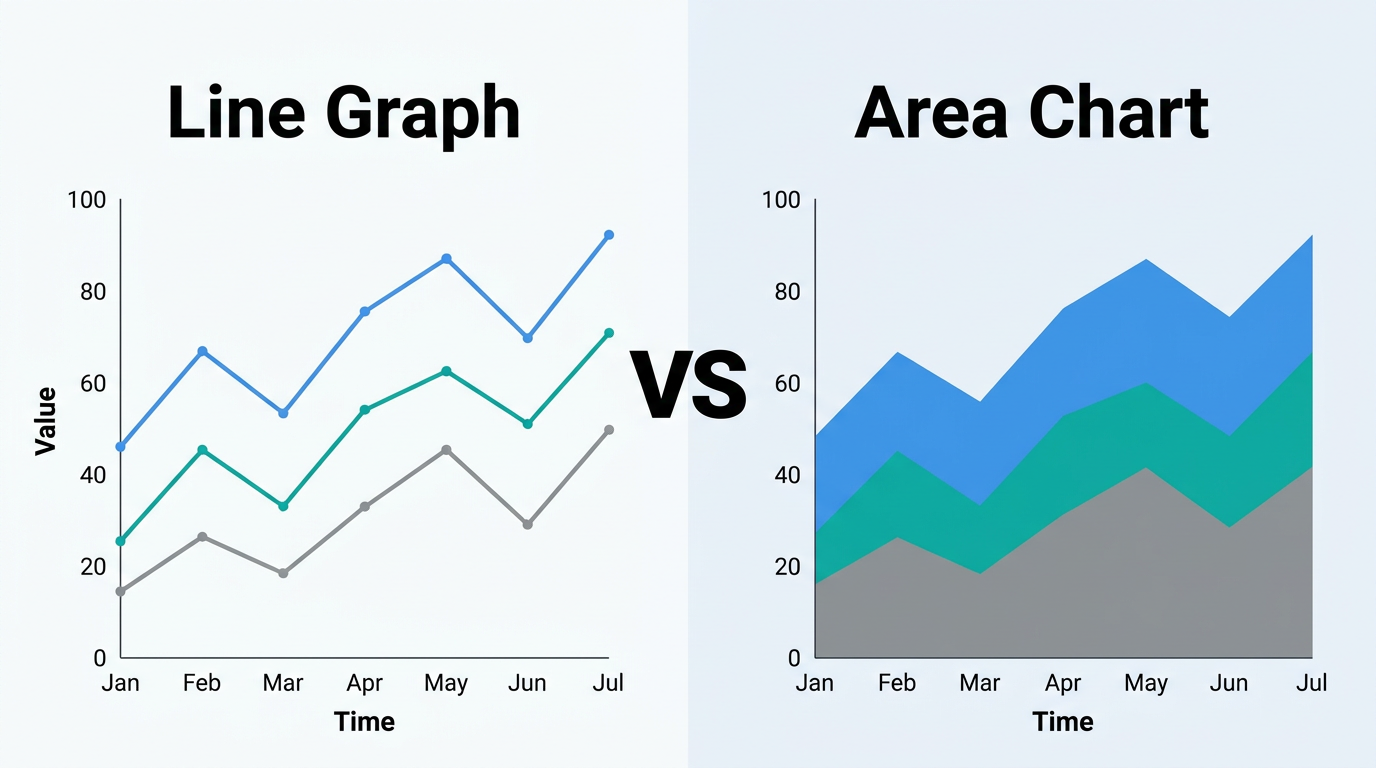
An area chart is a line graph with the space below the line filled in. That single design choice — filling vs. not filling — changes what the chart communicates, which questions it answers well, and when it misleads. Understanding the trade-off lets you pick the right one every time.
The Fundamental Difference
Line graph: Shows the trend of a value over time. The eye follows the line's shape — direction, slope, peaks, and troughs. The empty space below the line carries no meaning.
Area chart: Shows both the trend and the magnitude of a value. The filled area adds visual weight, making the eye register not just "where is the line?" but "how much is there?" The space below the line encodes information.
| Aspect | Line Graph | Area Chart |
|---|---|---|
| Emphasis | Trend direction and rate of change | Volume, magnitude, and cumulative quantity |
| Visual weight | Light — eyes follow the line | Heavy — the fill draws attention |
| Multiple series | Lines overlay cleanly | Areas overlap and obscure lower series |
| Best for | Comparing trajectories | Showing total volume or composition |
| Stacking | Not applicable | Stacked area shows part-to-whole |
When to Use a Line Graph
Comparing Multiple Trends
When you have 2–7 series and want to compare their trajectories, line graphs win. Each line is visible regardless of its position — the bottom line is just as readable as the top one.
Example: Comparing monthly revenue for 4 product lines. You can see which products are growing, which are flat, and where they cross over.
Why area fails here: With 4 overlapping filled areas, the bottom series gets buried. Even with transparency, the visual noise makes comparison difficult.
Emphasizing Rate of Change
The slope of a bare line directly communicates speed of change. A steep upward slope says "rapid growth" without any calculation. Adding an area fill shifts attention from the slope to the total filled space — diluting the rate-of-change message.
Showing Volatile or Noisy Data
When data fluctuates rapidly (daily stock prices, per-minute server metrics), the line's jagged shape is the signal. Adding an area fill amplifies the visual noise — every peak and trough creates a spike in the filled region that distracts from the overall trajectory.
Dual-Axis or Multi-Scale Comparisons
When two series have different units or scales, a line graph with distinct line styles (solid vs. dashed) keeps them visually separate. Area fills in this context would create overlapping blocks that confuse the viewer about which area belongs to which axis.
When to Use an Area Chart
Emphasizing Volume or Magnitude
When the message is about how much, not just which direction, the filled area adds weight that makes magnitude visceral. Build one with our free area chart maker, which supports overlapping and stacked layouts.
Example: Cumulative COVID-19 cases. The ever-expanding area under the curve communicates the relentless accumulation of cases in a way that a bare line does not.
Example: Total energy consumption over a day. The filled area visually represents the total energy used — peak hours have tall filled sections, off-hours are thin.
Stacked Area: Showing Composition Over Time
This is the area chart's killer feature — and something a line graph cannot do.
A stacked area chart shows multiple series stacked on top of each other, where:
- The total height at any point = the sum of all series.
- Each colored band's width = that series' contribution to the total.
Example: Website traffic by source (organic, paid, social, direct) over 12 months. You see both the total traffic growing AND how the composition shifts — maybe organic grows while paid shrinks.
Why line fails here: Multiple lines can show each source's trend, but they cannot show the total or the proportion of each source at a glance.
100% Stacked Area: Showing Proportions Over Time
A variation where all series stack to 100% at every time point. This removes the absolute magnitude and focuses purely on how the share of each category evolves.
Example: Market share of mobile operating systems (iOS, Android, Other) over 10 years. At every point, the chart sums to 100%, and you see iOS shrink as Android grows.
Single-Series Emphasis
For a single data series where you want the audience to feel the magnitude, a filled area chart is more impactful than a bare line. The fill creates a visual "weight" that communicates substance.
Example: A fundraising thermometer-style chart showing cumulative donations over a campaign. The growing filled area feels like progress in a way that a thin line does not.
The Overlap Problem
The biggest weakness of area charts is series overlap. When multiple unfilled (overlapping) areas are plotted:
- The frontmost series obscures those behind it. Even with transparency (30–50% opacity), the visual mixing of colors makes it hard to read individual series precisely.
- Colors blend unpredictably. Blue + yellow transparency creates green — which could be confused with a third series.
Solutions
- Stack the series if you care about the total. Stacking avoids overlap entirely because each series sits on top of the previous one.
- Use a line graph if you care about comparing individual series. Lines never obscure each other.
- Use small multiples — one area chart per series, sharing the same axes. Each series gets its own clear visual, and you can still compare by position.
Decision Framework
Step 1: How many series?
- One series → Either works. Area adds emphasis; line is cleaner.
- 2–3 series → Area (stacked) if composition matters; line if comparison matters.
- 4+ series → Line graph, unless stacking is the explicit goal.
Step 2: What is the message?
- "The trend is up/down/flat" → Line graph.
- "The total is growing and here is how it breaks down" → Stacked area chart.
- "This category's share is shrinking" → 100% stacked area.
- "Look at the magnitude of this quantity" → Area chart (single series).
Step 3: Is there overlap?
- Overlapping series → Line graph (always readable) or stacked area (no overlap by design).
- Non-overlapping or single series → Area chart is safe.
Real-World Examples
Revenue by Channel (Use Stacked Area)
You have monthly revenue from four channels: Direct Sales, Online, Partners, and Subscriptions. Your message: "Total revenue is growing, and Subscriptions are becoming a larger share."
Stacked area is perfect: the total height shows overall revenue growth, and the Subscriptions band visually widens over time.
A line graph of the same data shows each channel's individual trend, but you lose the "total" and "share" messages.
Website Speed: P50 vs P95 Latency (Use Line Graph)
You have minute-by-minute P50 and P95 response times for your API. Your message: "P95 spiked while P50 remained stable."
Line graph lets you see both metrics clearly — the P95 spike stands out against the flat P50 baseline. An area chart would fill the space between P50 and P95, creating a confusing shaded band instead of two clear lines.
Cumulative Sales Over a Quarter (Use Area Chart)
You have daily cumulative sales for one product during a promotional quarter. Your message: "We sold a massive volume and the pace accelerated in the final week."
Area chart (single series) makes the magnitude visceral. The growing filled area communicates accumulation in a way that a thin line does not.
Mobile vs Desktop Traffic Share (Use 100% Stacked Area)
You have monthly traffic split between mobile, desktop, and tablet for 5 years. Your message: "Mobile's share has grown from 30% to 70%."
100% stacked area is ideal: it shows the proportional shift without the distraction of absolute traffic changes. Mobile's band widens from bottom to top; desktop's narrows.
Build and Compare
With Line Graph Maker:
- Upload your time-series data.
- Create a line chart first — assess whether the trend alone tells your story.
- Toggle area fill on/off to see whether the filled version adds meaning or clutter.
- For multiple series, try stacked area to see the composition view.
- Export whichever version communicates your insight best.
The best chart is the one your audience understands in five seconds. Try both and pick the winner.
Frequently Asked Questions
Can I use both a line and an area on the same chart?
Yes. A common pattern is a filled area for a primary series and an overlaid line for a secondary series (e.g., area for absolute values, line for a moving average or target). Keep the area at low opacity so the line remains readable.
Is a stacked area chart always better than a stacked line chart?
Yes, for composition analysis. A "stacked line chart" where lines float above each other without fill makes it nearly impossible to gauge each series' contribution. The fill is what makes stacking work.
Should I use gradient fills in area charts?
A top-to-bottom gradient (full color at the line, fading to transparent at the x-axis) looks polished and reduces visual clutter. It is a good default for single-series area charts. For stacked areas, solid colors with low opacity are better — gradients on stacked series create visual confusion.
How do I handle negative values in an area chart?
The area below zero should fill downward (below the x-axis). Use distinct colors for positive and negative regions — green above zero, red below, for example. Stacking with negative values is complex and often confusing; consider separate charts for clarity.
When is a bar chart better than both?
When you need to compare discrete categories (not a time sequence), a bar chart wins. Both line graphs and area charts imply continuity and sequence. If your x-axis is "Department" or "Product Name," use bars.
Can area charts work for real-time dashboards?
Yes, but use a fixed time window (last hour, last 24 hours) so the chart does not accumulate infinite history. For streaming data, area charts are effective for showing volume over time — the filled area immediately communicates "busy period" vs. "quiet period."
What about radar/spider charts vs area charts?
Radar charts use area to compare multiple categories in a circular layout. They are useful for comparing profiles (athlete skills, product features) but poor for time-series data. Stick with standard area charts for temporal data.
Share this article
Help others discover this content
Published on April 21, 2026
Last updated on July 21, 2026