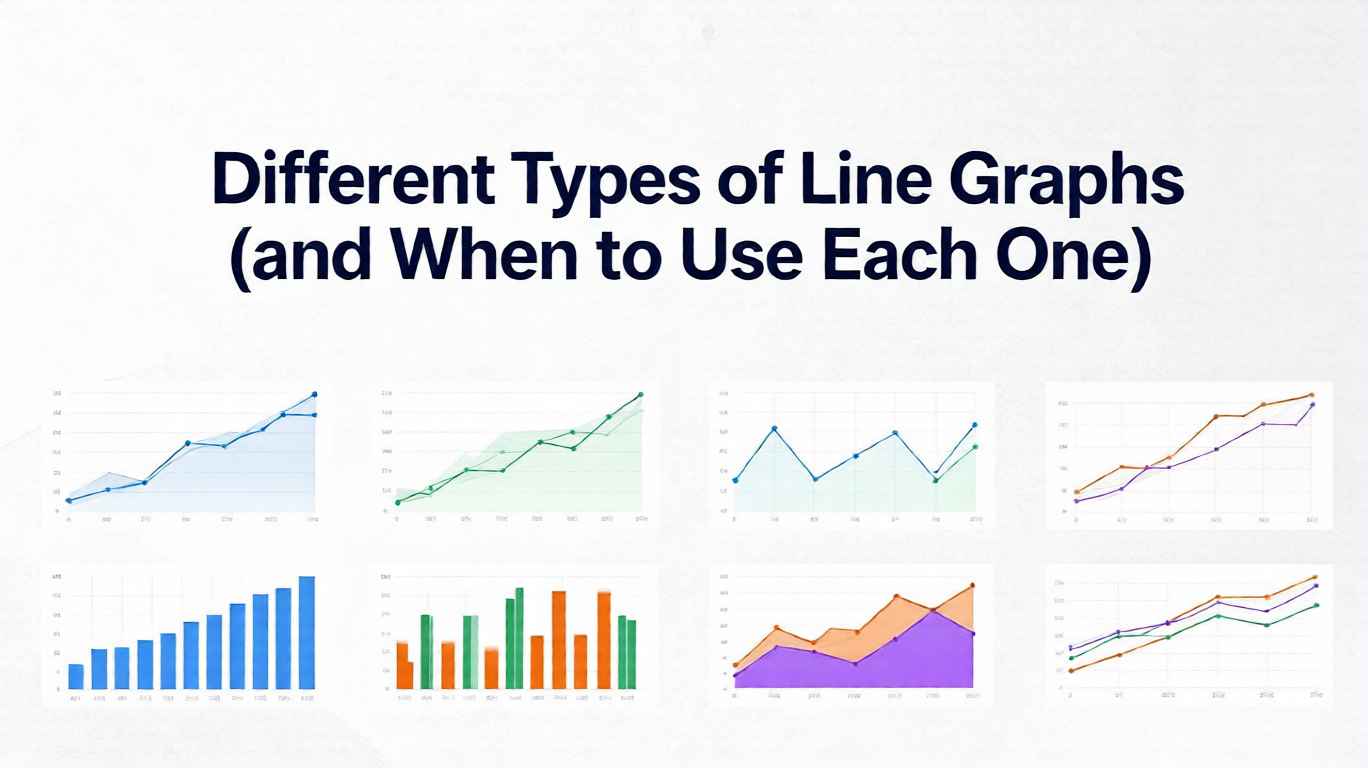
Line Chart Examples & Templates
Browse through our collection of 27+ professional line chart and line graph templates you can use directly in our line graph maker. From basic trends to advanced visualizations.

Basic Line
A standard single or multi-series line chart showing trends over an ordered domain. Includes interactive example, sample CSV data, and free PNG/SVG export.

Smoothed Line
Curved spline lines emphasize overall tendencies while smoothing out noise. Ideal for presentations where visual clarity matters more than pinpoint accuracy.

Step Line
Stair-step transitions highlight discrete changes and hold periods in your data. Perfect for pricing tiers, status changes, and categorical shifts over time.

Basic Area
Fill under a line to emphasize accumulated magnitude and visual density. Create area charts with custom colors, gradients, and opacity in our free online maker.

Stacked Area
Multiple series stacked to show part-to-whole composition over time or categories. Visualize market share, resource allocation, and cumulative trends.

Area with Time Axis
Zoomable daily area chart with built-in range selector, quick export tools, and date-time axis formatting. Ideal for time-series dashboards.

Dynamic Line with Time Axis
Live-updating time series with streaming or windowed data for real-time monitoring. Build dynamic dashboards that auto-refresh with new data points.

Log Axis Line
Logarithmic scale reveals multiplicative growth and power-law behavior across orders of magnitude. Essential for scientific data and financial growth curves.

Multiple X Axes
Two or more aligned x-axes to compare different units or granularities in a single chart. Overlay temperature and humidity, or revenue and user count.

Stacked Line
Accumulate series vertically to compare cumulative totals without area fills. Show aggregated trends while keeping individual series distinguishable.

Gradient Stacked Area
Stacked area chart with smooth gradient fills to emphasize composition transitions. Create polished visualizations with customizable color gradients.

Area Pieces
Segment the area fill by value ranges for conditional emphasis and threshold highlighting. Ideal for event-based analysis and anomaly detection.